

TL;DR: Using the Google Analytics add-on for Google Sheets combined with this custom dashboard, you can easily analyze what’s causing organic traffic to decline.
Have you ever logged into Google Analytics and noticed organic traffic trending downward over the past couple of weeks? It happens—we’ve all been there.
As SEO analysts, this is where we get to show off our ability to tell a story with data, and to uncover the cause of the downward trend. But to get answers requires a real time commitment and patience.
Search Engine Optimization has a lot of variables to consider when trying to track down the cause of a traffic decline. It can be extremely time consuming and tough to decide where to begin.
This is where my dashboard comes in. Below, I’ll walk through our custom analytics dashboard that gives you a quick overview of what’s going on with your traffic and highlight where the issue might be stemming from.
My dashboard will help you see:
- If you’re losing organic visibility in a specific city where you previously dominated.
- If there’s a high probability that top landing pages lost valuable organic positions.
- If the drop in organic traffic is impacting conversion metrics.
- If other traffic sources are down, which can help identify the impact of other marketing channels.
- If the drop in traffic is specific to a device type.
Getting Started
To get started, download the dashboard, and then File>Make a copy. This will create a personal version of the dashboard and allow you to make changes to the sheet.
Pro Tip: Before you go any further, make sure the Google login you use to download the dashboard has access to your Google Analytics accounts; otherwise, you won’t be able to run any reports.
Setting Up Your Dashboard
First, enter your Google Analytics View ID in the cell to the right of the “GA ID:” field. You can find your View ID in the Google Analytics interface under Admin > View > View ID.
Make sure to include “ga:” in front of your View ID.
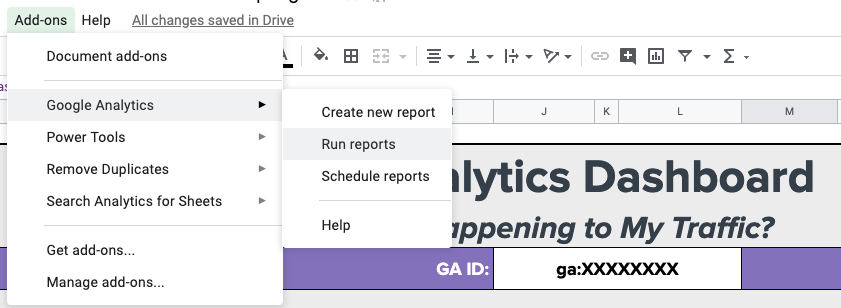
Once your View ID is in place, just click “Run reports” under the “Add-ons” menu.
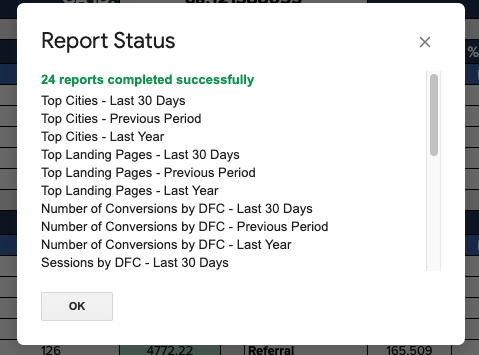
You should get a pop-up saying 24 reports have run successfully.
What the Dashboard Will Show You
The dashboard has seven different tables, each showing the percent change in the last 30 days versus the previous 60 days, and a year-over-year comparison for the last 30 days. The tables include:
- Top cities from organic visitors
- Top landing pages from organic visitors
- Organic visitors by each month of the year for the past three years
- Goal completions
- Default channel groupings
- Device type
- New vs. returning visitors
It Does the Analysis for You
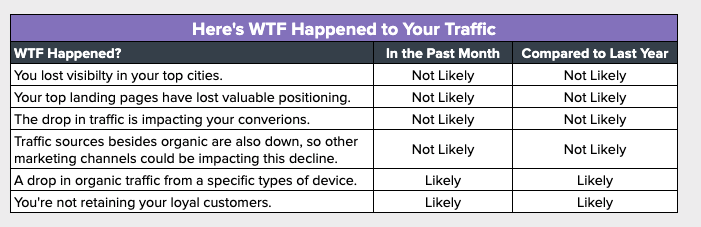
The best part of the dashboard is that it analyzes your data for you and tells you how to prioritize your investigation.
In the final table of the dashboard, you’ll get a review of what’s happened to your traffic and if the stated reasons are likely to be the cause of the decline.
Run, Analyze, Learn, Take Action
Boom, that’s it. That’s literally all you have to do to find out WTF happened. Everything will populate on its own, and you’ll be free to begin analyzing in greater detail.
Is something not working properly for you on the WTF is Happening to My Traffic Dashboard? Did you find a good use case of the dashboard? Want to tell me how I can make it better? I’d love to hear it! Tweet me: @kellyjw514.